
We use regression analysis frequently in our energy engineering analysis, but results can be less than ideal for many cases. Now with big data and the current technology of faster computing, we can use a comprehensive understanding of statistics, hypothesis testing, and principles of inference to better predict and verify energy savings, and mitigate the risk involved with various uncertainties surrounding energy efficiency projects. In this and following posts, I will provide you with the building blocks to understand this aspect of energy analysis.
Analyzing building energy use
The data we collect is a sample of an overall population. We use it to evaluate the relationship between independent variables and the resulting energy use data in the population. There are two main questions we ask before making any conclusions about the population based upon the sample:
- Is this sample representative of the population?
- Is the relationship between variables, that we are seeing in the sample, a real relationship?
Let’s take a look at data from a source that contains an entire year’s of 15-min data:
Answering question one, this data covers all seasons and all operations and can, therefore, be considered as being representative of the population[i], implying that if the conditions for regression and statistical inference are satisfied, this sample can be used to derive conclusions about the population.
The second question is answered using the p-value. At its core, the p-value attempts to clarify whether the correlation between the variables as seen in the sample is purely chance, or if an actual relationship exists.
Getting to know p-value
Let’s use the example below to understand how the p-value applies to energy use analysis.
Say you have two variables: outside air temperature (OAT) and the metered power of a building seen in the example below[ii].

Figure 1: Daily Electric Use vs. Temperature
If you list this data in Excel and use the Data Analysis add-in to run a regression, the output you see will be similar to this:
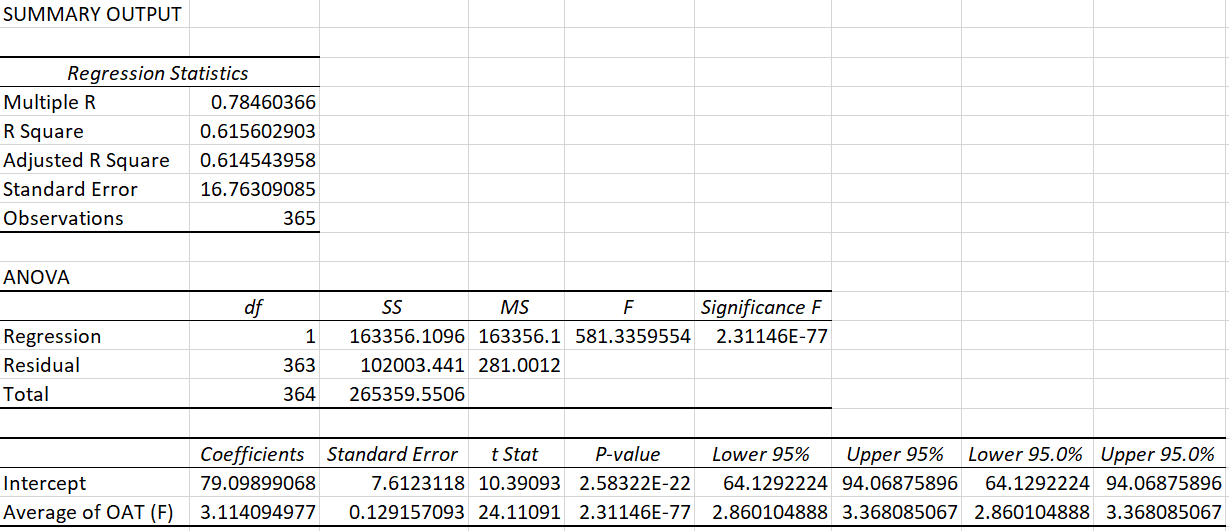
Figure 2: Data Analysis Summary Output
In the case of this dataset, we see an R-squared value of 0.62. Going by the popular opinion, of wanting an R-squared value of at least 0.75 or higher, one would deem this model as ‘bad’ and rush to discard its summary output. But before we do, let’s pause and divert our attention to the p-value (highlighted in red above).
What is the purpose of a regression analysis for energy use?
When we run a regression analysis on a sample dataset and find a correlation between its two variables (as seen in Figure 1 above), we are, in effect, testing a hypothesis:
- The null hypothesis (Ho) states that, in the population data, there is no relationship between the independent and the dependent variable.
- The alternative hypothesis (Ha) states that there is a relationship between the two.
In the case of our dataset, the null hypothesis states that outside the sample, i.e. in the population, there is no relationship between OAT and metered energy use.
The alternative hypothesis states that there exists a relationship between the two, not just in this sample but also within the population data. Our aim, with the hypothesis test, is to prove the alternative hypothesis true. Afterall, we will only be able to make correlation-based decisions for the building and/or the energy system if the correlation exists beyond the sample and for the entire population data.
The technical definition of the p-value is:
The probability of observing data, at least as favorable to the alternative hypothesis as the sample dataset, if the null hypothesis were true.
The p-value varies theoretically between 0 (i.e. no relationship) and 1 (any sample would show direct relationship).
What does this p-value mean relative to our dataset?
Referring back to Figure 2, we can say that the probability of observing data in the population, that is as least as favorable to the alternative hypothesis as seen in the sample above, is very close to zero (2.31136E-77), if in fact the null hypothesis were true. Given that this probability is so small, we can confidently say that a relationship between OAT and metered energy use exists in the population data.
What if the p-value was higher than zero?
A p-value higher than zero, let’s say 0.05, means that there is a 5% probability of observing a relationship between variables in the sample data, if in fact no relationship exists in the population. In this scenario, if we drew random 100 samples from a population, we would observe a relationship between variables in at least in five samples. The correlation observed in the five samples would then be misleading if we were to use it as the basis of our energy savings calculations.
A p-value of 0.1 increases this error rate to 10%.
It is recommended to keep the p-value under 0.05. If the stakes are too high and an error can be costly, the p-value may be dropped down to 0.001 (1% error rate).
Moving beyond regression analysis
So, the next time you see results of a regression, don’t just focus on R-squared value. Take a look at the associated p-value to evaluate if the relationship you are seeing in the regression is true or is simply a result of well-aligned numbers. And, if you need help evaluating energy savings, contact us anytime.
Like this post? Share it on LinkedIn.
You can download sample data here.
[i] The data is assumed to contain no non-routine events
[ii] Source: https://openei.org/datasets/dataset/consumption-outdoor-air-temperature-11-commercial-buildings