I’ve written before about the special challenges of benchmarking lab buildings’ energy usage. It’s always been worth the extra effort, but I’m happy to report that we’ve finally made lab benchmarking a little bit easier. It’s my great pleasure to introduce the brand new Lab Benchmarking Tool (LBT)!
kW Engineering designed and developed the LBT in collaboration with Lawrence Berkeley National Lab (LBNL) and the International Institute for Sustainable Laboratories (I2SL). Creation of the LBT was sponsored by DOE’s Federal Energy Management Program. We leapt at the chance to work on this project, and we’re really proud of what the team achieved.
The Challenge with Labs
First, a little background on why the LBT was so badly needed.
Labs are challenging to benchmark, mostly because their functional requirements are so detailed and varied – they’re all special snowflakes.  Tools and resources for lab benchmarking have always been limited, and the Labs21 Benchmarking Tool was really the only game in town.
The Labs21 site was referenced by all the rating programs that accommodate lab buildings, and was typically used by anyone benchmarking a lab building for an ASHRAE audit – or for any other reason. The tool allowed users to benchmark their lab buildings by filtering an anonymized peer group building dataset that was assembled from user-submitted data. The key feature was that the filters were lab-specific – e.g. type of lab (bio, chemistry, etc.) and percentage of building covered by lab space – in addition to standard filters such as climate zone and hours of occupancy.
With very few software updates since its original launch in 2002, the Labs21 tool was showing its age. The graphing and filtering interfaces were clunky, tool maintenance was inconsistent, some of the data fields were outdated, and some data quality issues had crept into the database.
But the Labs21 tool was sitting on top of a goldmine of data from 750 lab buildings – which is perhaps 5-10% of the total lab building area in the US! Most of the data was actually quite recent – despite the age of the Labs21 tool, users were still regularly entering data on their buildings.

The Labs21 tool is no more – it was retired by LBNL when the LBT went live. We think you’ll love the new tool – the project was a real treat for the kW team to work on, and we’re really pleased with the results.
Key Features of the LBT
Like its predecessor, the LBT is free to use. The LBT is built around the goldmine of Labs21 data, the data is still stored securely at LBNL, and the LBT still allows you to benchmark your labs by filtering the peer group dataset. But that’s where the similarities end.

The new LBT is designed to make comparisons between lab buildings clear, intuitive, and useful. Highlights include:
- A modern graphing interface, with plots that are attractive enough to go straight into audit reports. LBT options include scatter plots, histograms, and sorted column plots.

- Greatly expanded access to the anonymized peer group database – you can now filter on almost all the parameters in the data, rather than just a select few.
- Reconfigured lab type fields to accommodate modern buildings such as integrated science centers.
- Updated HVAC system and controls features options to reflect the systems and features present in today’s labs.
- Flags on filter options that don’t (yet) have much data in them – this helps to save you time when selecting filters.
- User-selectable units for entering energy usage data – because nobody ever does that ton-hours to MMBtu conversion correctly.
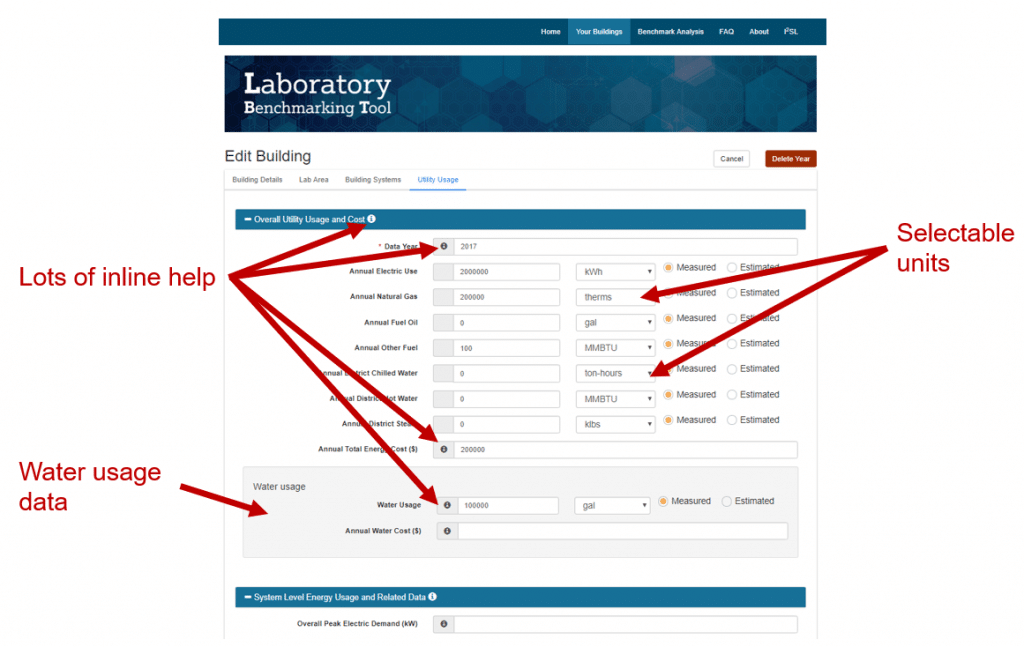
- Water usage data – a new field added to the database, reflecting today’s increased need for water use efficiency.
- Better data quality checks – by catching common errors at the time of data entry, the quality of data in the peer group database will improve over time.
- Extensive inline help and FAQs.
The Future of the LBT
As of today, the LBT basically does what the Labs21 tool used to do – it just does it much better. However, we designed the LBT with expansion in mind. We’ve already started building new modules to expand the LBT’s functionality, so please stay tuned for announcements on those in the coming months! We’re also looking for sponsors to support development of additional new modules – so just let me know if your company would be interested in making the LBT even more useful (and having its logo on the LBT site, of course).
Let Us Know What You Think!
Give the LBT a try whenever you next need to benchmark a lab building, and let me know what you think!
Like this post? Share it on LinkedIn.