You created a regression model of your building’s energy use and now want to use its predictive capabilities. How do you go about assessing your model’s predictive power? As I mentioned in an earlier post, you want to steer away from focusing on a singular metric and build a comprehensive understanding of the model.
Let’s take a look at a sample dataset using daily electricity consumption.
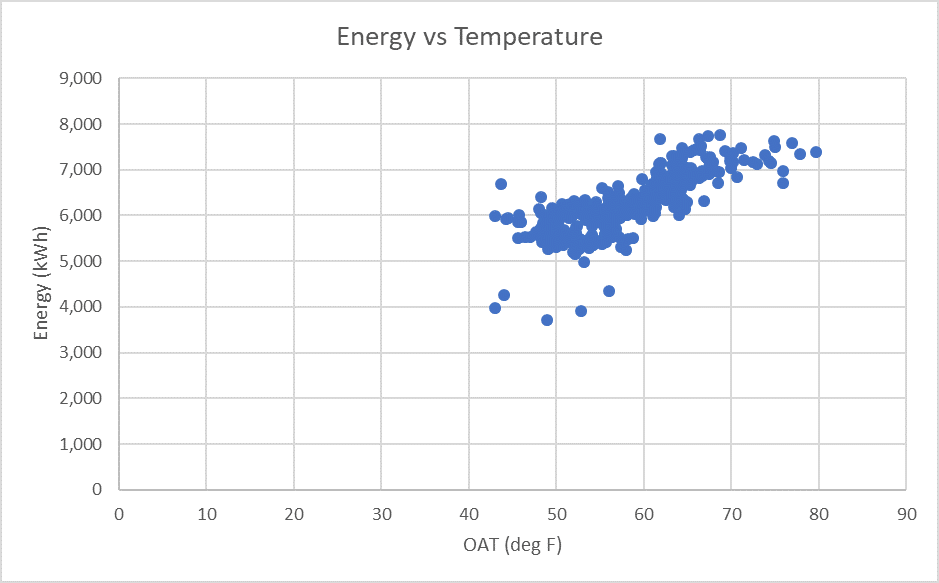
Figure 1: Daily Electric Use vs. Temperature
Here is the output from the Data-Analysis add-in in Excel.
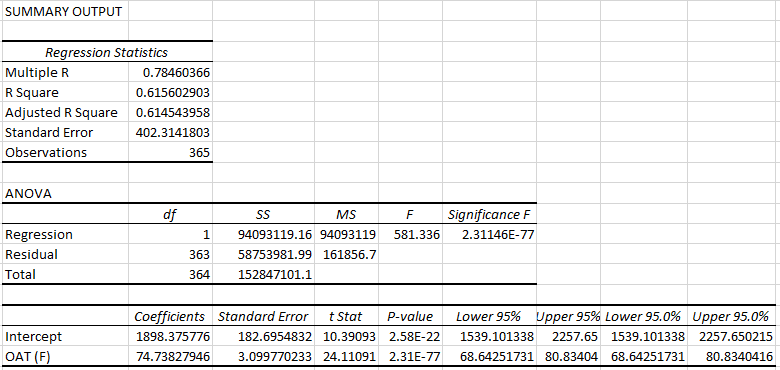
Figure 2: Data Analysis Summary Output
The R-squared value does not paint an optimistic picture by itself (some sources suggest 0.75 as a lower threshold). However, when combined with other metrics, it can provide us an insight into what is actually happening under the hood.
R-squared
R-squared is a statistical measure of the variation in the dependent variable as explained by the linear model. By definition, it is only explanatory and not predictive. In the example given above, the R-squared value will be interpreted as:
62% of the variation in the building’s energy use is explained by the linear model: Energy Use = 74.7 + 1898.36 * Dry Bulb Temperature.
To gauge the predictive capability of the model, we could use it to predict the energy use of building and compare those predictions against the actual energy use. The statistical measure that allows us to quantify this comparison is the Coefficient of Variation of Root-Mean Squared Error, or CV(RMSE).
Coefficient of Variation of Root-Mean Squared Error – CV(RMSE)
Root-Mean Squared Error, as you might remember from your statistics class, is given by:
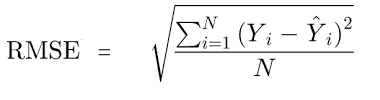
You begin by squaring the difference between the predicted and the actual values. This difference (residual) represents the variation in the dependent variable, unexplained by the model. Adding all the squared residuals, dividing by the number of observations, and taking the square-root of the result gives us the metric, Root-Mean Squared Error. This indicates the absolute fit of the model and shows how close the predicted values are to the actual data points. It gives an objective representation of the predictive accuracy of the model.
CV(RMSE) takes this metric one step further, by normalizing it by the average dependent variable value.
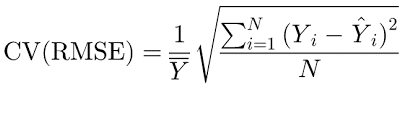
As per ASHRAE Guideline 14, a CV(RMSE) of and below 25% indicates a good model fit with acceptable predictive capabilities. For the dataset given above, The CV(RMSE) was found to be 6%, implying that the model is reliably predictive.
Putting The Two Together
The R-squared value of 62% indicates that there could be additional predictors that explain the remaining 38% variability in energy use. The CV(RMSE) value of 6%, on the other hand, indicates that, on average, the prediction error is 6%. It is important to note that CV(RMSE) quantifies the average error and not the error observed over individual data points. So, although there might be individual days in a facility when the energy consumption is affected by factors not accounted for in the model, overall, it provides reliable average predictions.
Visualize your data
When creating empirical models, I like to visualize the data and understand patterns in usage and errors. Here is the actual data along with the predicted values plotted on top:
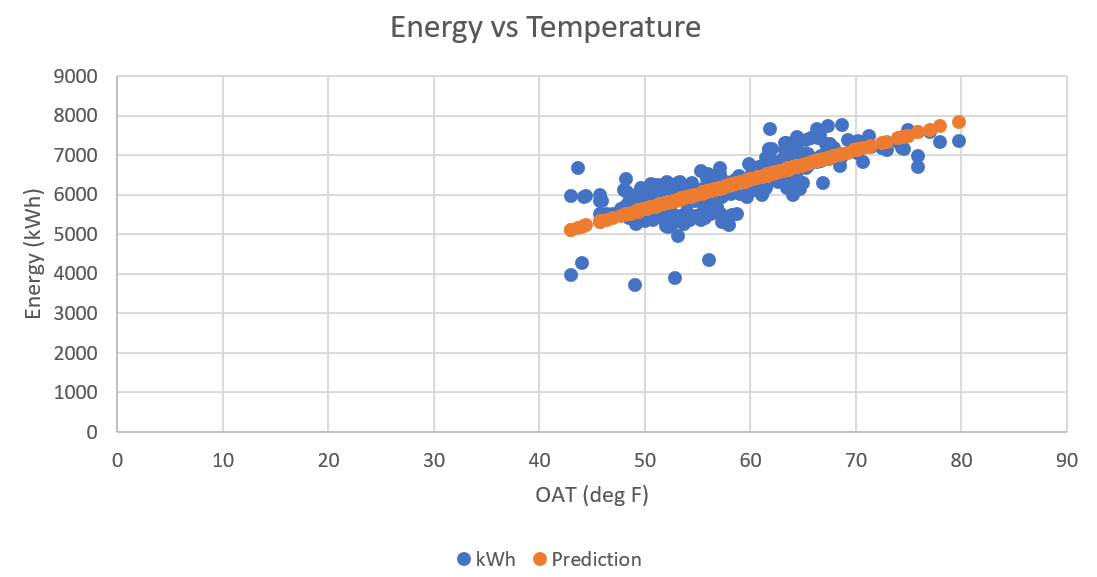
Figure 3: Actual & Predicted Energy Use vs. Temperature
We can see that while model’s R-squared value is quite low, it captures most of the energy consumption behavior of the facility, and so can be safely used for energy use prediction.
So, the next time you run a regression analysis on energy data, calculate its CV(RMSE) to understand the model’s predictive accuracy. In addition to being able to flaunt your expertise on the subject, you will also significantly reduce your workload when the time for Measurement & Verification rolls around. If you’d like to dive deep into your energy use data and need help identifying opportunities for energy savings, contact us any time.
Like this post? Share it on LinkedIn.


