
There’s a lot of buzz in our state right now around the concept of M&V 2.0 and Normalized Metered Energy Consumption (NMEC). The term was created as part of AB 802 in 2015 with the inclusion of the following proposed simplified means of counting energy efficiency savings:
“(the commission shall…) authorize electrical corporations or gas corporations to provide financial incentives, rebates, technical assistance, and support to their customers to increase the energy efficiency of existing buildings based on all estimated energy savings and energy usage reductions, taking into consideration the overall reduction in normalized metered energy consumption as a measure of energy savings.”
With that stroke of the pen, an old approach to energy savings and baseline treatment has been renewed. I would have dubbed it ORNMEC so that we don’t forget that it is Overall Reduction . We should be stubborn and ‘ornery’ about that.
Using metered data to estimate savings means those savings must be significant, otherwise we don’t “see” them at the meter. So NMEC projects by nature must achieve real savings. As an engineer, it’s very appealing to spend more of my time finding, implementing, and commissioning projects that save our customers money, reduce their reliance on fossil fuels, and create markets for innovative technologies. The requirement to quantify “all savings” is also very attractive for our clients, because it lines up with how they think about energy efficiency projects – “how much did I save this month on my energy bills?”
Savings based on NMEC is similar to the Option C Whole Facility Approach of the industry standard measurement and verification (M&V) guidebook, IPMVP (International Performance Measurement and Verification Protocol). This approach uses empirical modeling, such as statistical regression, to develop relationships between energy use and independent variables. These relationships are needed to “normalize” energy use.
“Normalized” is a term with many possible interpretations. But, generally speaking, it’s been interpreted to mean a statistically valid method to adjust pre- and post- project energy use to a common set of conditions, so that savings can be properly estimated. Typically, energy use is normalized based on weather data, though you could also use other variables shown to influence energy consumption. For instance, in industrial plants, production levels (e.g. number of widgets or pounds of product) are likely to be correlated with energy use. In office buildings, operation schedules are a major influence. The key is that we can identify and develop a reliable relationship between energy use and its influencing factors.
I like that the legislation described “metered” energy use and did not use limiting language such as whole-building in its description. With the availability of cheaper sensors, improved connectivity, and a greater prevalence of system-level data, we can apply NMEC methods at a more granular scale; building subsystems. This approach has several advantages; savings will be a larger portion of the measured energy use, savings are measured where they are achieved, and owners obtain more direct and actionable information about the performance of their systems. The axiom “you can’t manage what you don’t measure” is foundational with NMEC methods.
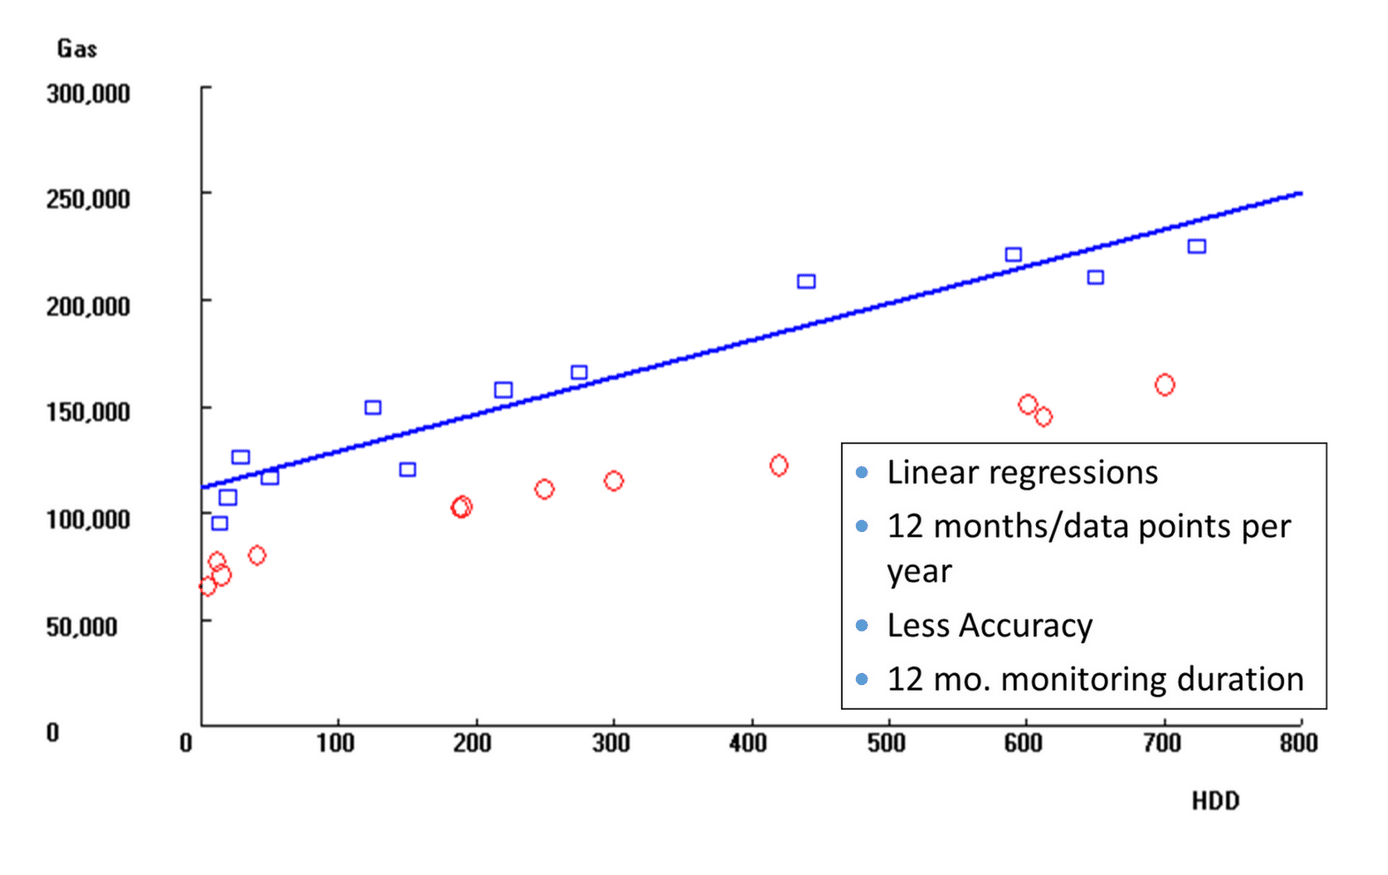
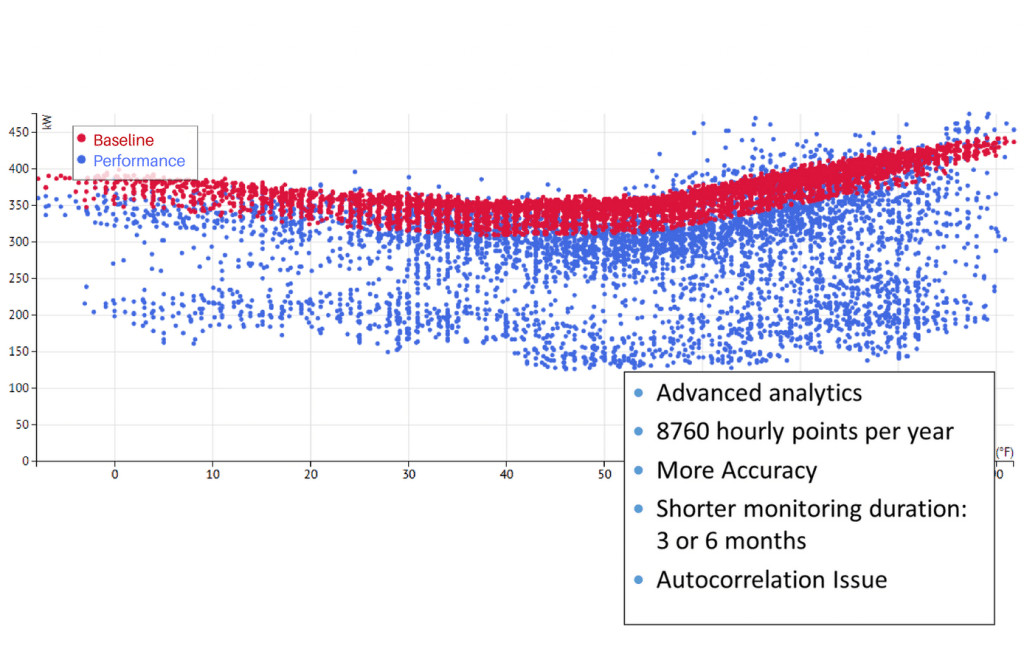
Whole building approaches are nothing new. Energy service companies (ESCOs) have been using regressions with monthly billing data for decades. But what’s changed is that now, more buildings have smart meters that can provide average consumption or demand data every 15 minutes. Compared to linear regressions using twelve points of billing data, we can now develop energy models with thousands more data points per year.
However, simple regression methods are inadequate for developing energy models with so much data. Advanced algorithms and machine learning approaches have been developed, with impressive names such as ”vector machines,” ”neural networks,” and ”random forests”. These algorithms can result in more accurate energy models, but the drawback is their complexity and unfamiliarity to the layperson. In most cases, the relationships cannot be expressed as a simple equation in an M&V Plan.
Advanced algorithms do lend themselves to automation, and many companies now provide automated M&V methods as a part of their software. M&V 2.0 is a term coined to refer to these next generation applications based on M&V 2.0 approaches have demonstrated the ability to improve model accuracy, add greater statistical validity, and, most importantly, to provide faster feedback. This real-time feedback helps catch operational issues as they occur.
M&V 2.0 approaches provide faster feedback to help catch operational issues as they occur.
This approach is very compelling for many reasons:
With simplicity comes some complications as well:
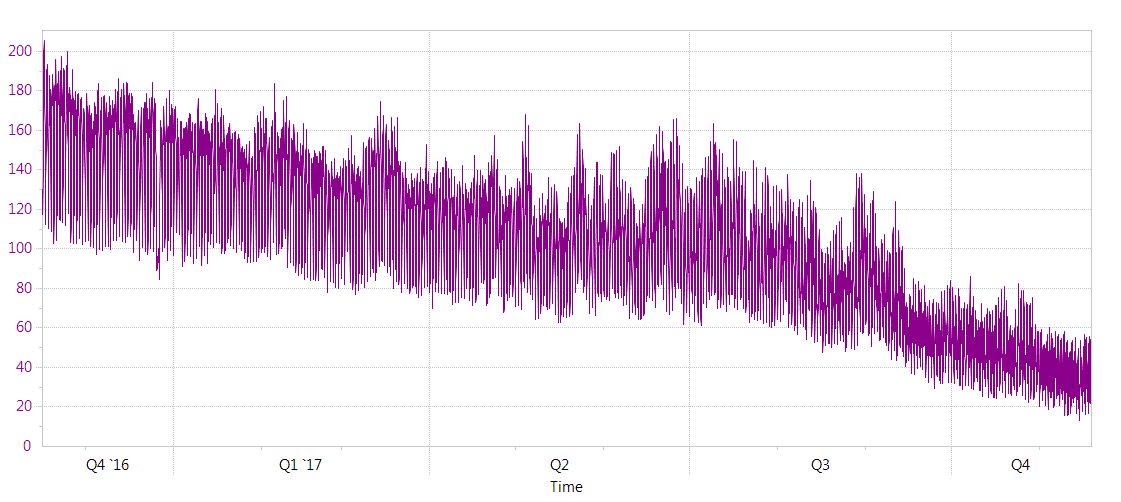
Data of a “Bad Building”
Non-routine events (NREs) are the greatest risk in using whole building meter-based methods. Changes in building energy use can be caused by factors unrelated to efficiency measures and, if ignored, can result in biased savings estimates. Methods to identify NREs and quantify their impacts are only starting to emerge. One way to avoid NREs is to focus on metered building subsystems.
Currently, all the IOU’s in California, and many third parties, are implementing or considering various combinations of NMEC approaches, through High Opportunity Programs and Projects (HOPPs), whole building pilots, and as potential components of new pay for performance programs. Given the limited experience with using these methods for program savings claims, we see some potential problems.
Here at kW we’re excited by these possibilities and looking forward to working through the issues as they come up. Overall, we believe NMEC helps us achieve our core mission; to save our customers energy, money, and help reduce carbon emissions in the process.
Southern California Edison will soon release an NMEC Savings Procedures Manual that describes how to conduct the savings estimation process on a site-by-site basis. It describes the typical issues encountered, and how to manage them. It will be available on the California Emerging Technology Coordinating Council’s website, www.etcc-ca.com.
For additional posts on NMEC, read more on the blog.
For information on our free toolkit for performing NMEC using R, check out nmecr.
Like this post? Share it on LinkedIn.